
Mapping Sneaker Shipment Data for Reverse Logistics Company
This project uses Google Colab to map sneaker shipment activity across the United States at the ZIP Code Tabulation Area (ZCTA) level. Shipment data was aggregated and spatially joined to ZCTA boundaries to visualize geographic patterns in distribution volume and quantity.
Workflow (Google Colab’s Gemini aided in this process)
1: Data Inputs
- U.S. ZCTA shapefile (Census TIGER/Line)
- U.S. state boundaries shapefile
- Sneaker shipment dataset (CSV)
- Includes shipment ZIP codes, weight, category, and CO2e estimates
2: Data Cleaning and Preparation
- Imported shipment data
- Converted delivery times to datetime format
- Removed incomplete or invalid records and records from 2023
- Created a standardized 5‑digit ZIP/ZCTA identifier
- Extracted year values to enable temporal comparison
3: Aggregating Shipment Data
- Filtered data for 2024 and 2025
- Aggregated shipments at the ZCTA level:
- Total shipment weight (lbs)
- Number of shipments
4: Spatial Join with ZCTA Boundaries
- Loaded ZCTA shapefile
- Joined aggregated shipment data to ZCTA polygons
- Filled missing values with 0 for areas without shipments
5: Converting Polygons to Map Points
- Used representative points to convert polygons into point features
6: Data Normalization for Visualization
- Applied square root scaling to shipment weight and counts
- Created proportional marker sizes
7: Map Production
- Reprojected data to a U.S. Albers projection (EPSG:5070)
- Overlayed shipments on a continental U.S. base map
- Created four map outputs
Final Maps
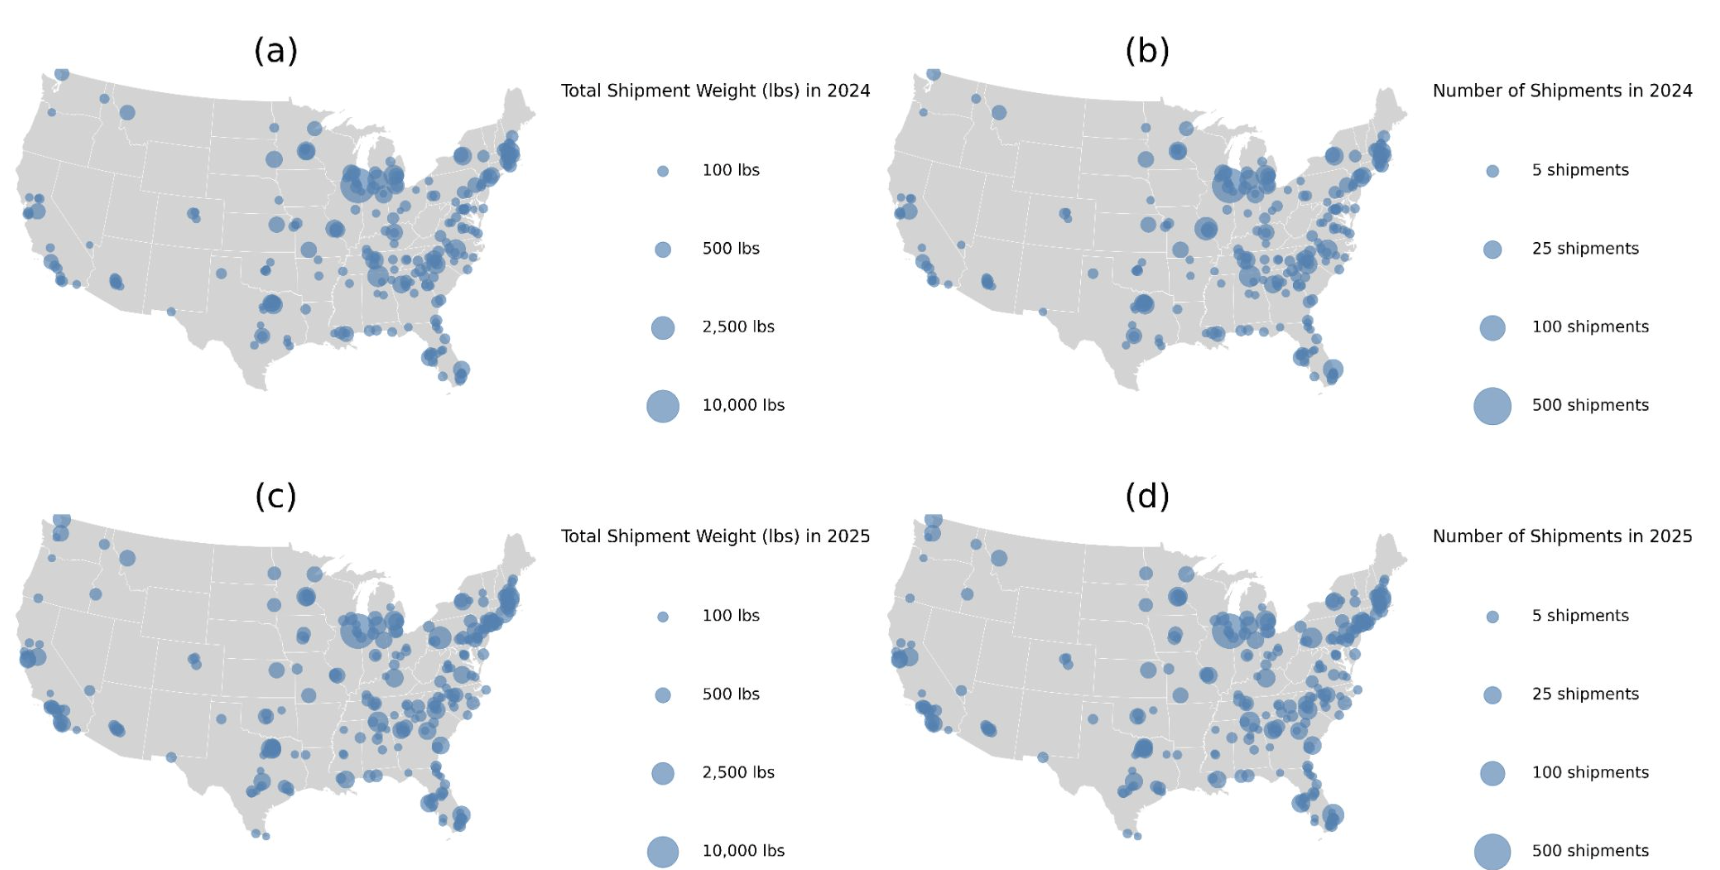
These maps reveal that sneaker donation shipments are broadly distributed across the United States, with the highest concentration of participating ZCTAs located in the eastern half of the country, particularly in the Southeast, Midwest, and Northeast. Larger shipment weights and higher shipment frequencies are concentrated around major metropolitan areas, suggesting that population density and access to donation infrastructure strongly influence participation in the reverse logistics network. Comparing 2024 and 2025, the spatial distribution appears relatively consistent, although several regions show increases in shipment counts and shipment weight, indicating growing participation and expansion of the sneaker recovery program over time.
Tools
- Python (Pandas, GeoPandas, NumPy)
- Matplotlib
- U.S. Census TIGER/Line shapefiles
- Google Colab
Data Sources
- U.S. Census Bureau (ZCTA and State boundaries)
- Internal sneaker shipment dataset