
Spatial Analysis of Capital Bikeshare Access and Metrorail Ridership in Washington, D.C.
This project uses GIS to quantify bikeshare accessibility at WMATA Metrorail stations and examine its relationship with station‑level Metro ridership. Using buffer analysis and spatial joins, I constructed a monthly panel dataset linking bikeshare usage to transit demand. The dataset was then used in spatial econometric models to assess how bikeshare activity and station centrality influence ridership patterns.
Workflow:
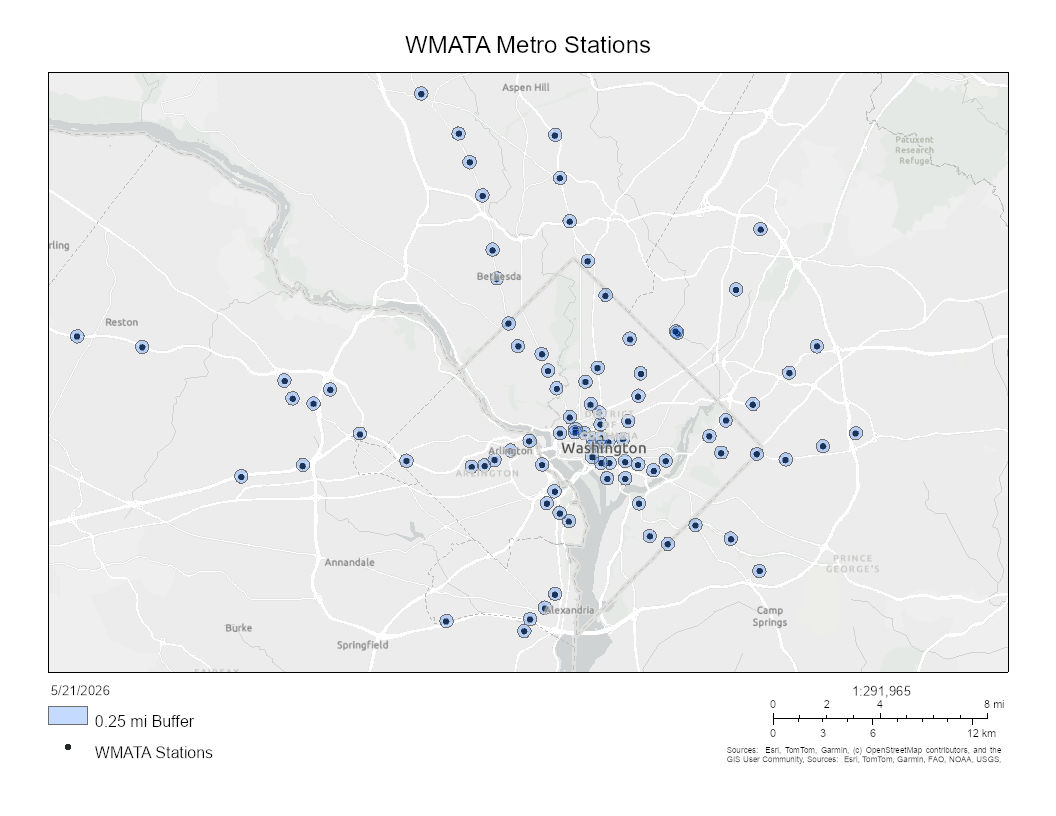
1: Defining accessibility zones
Created 0.25‑mile buffers around Metrorail stations
- Walkable access distance
- Represents station catchment areas
2: Spatially linking datasets
Performed one‑to‑many spatial join
- Metro station buffers → CaBi stations
- Linked bikeshare stations to their nearest Metro station catchments
3: Aggregating spatial data
Used Summary Statistics to aggregate CaBi ridership at the station–month level
- Grouped by: station, year, month
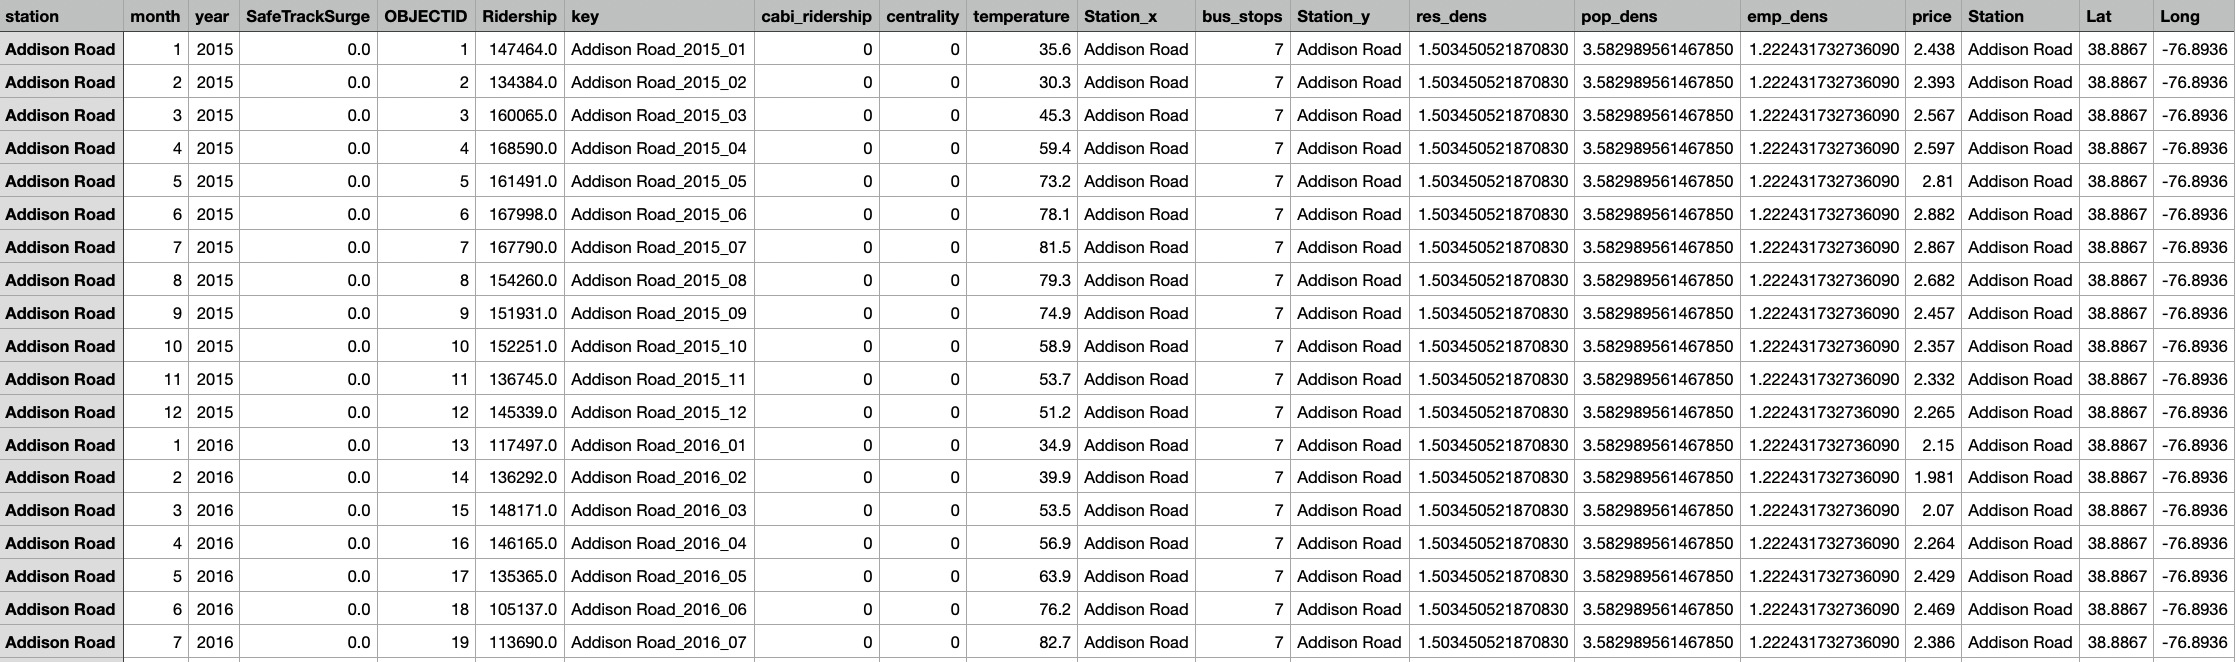
4: Creating a panel dataset
Integrated:
- Metro ridership
- GIS‑derived CaBi variable
- Time variables
- Controls (temperature, gas price, etc.)
The GIS workflow transformed raw bikeshare and transit data into a station‑level panel dataset, allowing me to estimate spatial panel regressions. The results show that bikeshare and Metrorail ridership are positively associated in central areas, suggesting a first‑/last‑mile complementarity, while relationships differ in peripheral areas.
Tools:
- ArcGIS Pro (buffers, spatial join, summary statistics)
- Excel (data cleaning)
- Stata
Data Sources:
- Washington Metropolitan Area Transportation Authority
- Capital Bikeshare