Habitat Suitability Analysis for Puma concolor coryi
This project uses GIS-based multi-criteria analysis to identify suitable habitat for the endangered Florida panther (Puma concolor coryi). Environmental and anthropogenic factors including land cover, vegetation health, roadway proximity, and storm surge risk were reclassified and weighted to produce a composite habitat suitability surface. The resulting model highlights priority areas for conservation, restoration, and potential habitat expansion.
Workflow
1: Data Inputs
- Land cover
- Vegetation Condition Index (VCI)
- Distance to roads
- Euclidean Distance was used to calculate distance from roadways, as panthers are highly sensitive to road presence
- Storm surge
These variables represent key ecological and anthropogenic drivers of habitat suitability for Florida panthers
2: Reclassification
Each variable was reclassified into a standardized 1–5 suitability scale based on ecological relevance
| Factors | 5 Highly Suitable | 4 Suitable | 3 Moderately Suitable | 2 Marginally Suitable | 1 Not Suitable |
|---|---|---|---|---|---|
| Land Cover | Natural Forests | Wetlands | Emergent Wetlands | Agriculture | Urban / Developed |
| VCI | > 0.85 | 0.70–0.85 | 0.5–0.7 | 0.35–0.50 | < 0.35 |
| Distance to Roadways (meters) | > 5,000 | 2,500–5,000 | 1,000–2,500 | 500–1,000 | < 500 |
| Storm Surge | No Flooding / Cat 5 | Cat 4 | Cat 3 | Cat 2 | Cat 1 |
3: Create Transformed Maps for Suitability Modeler
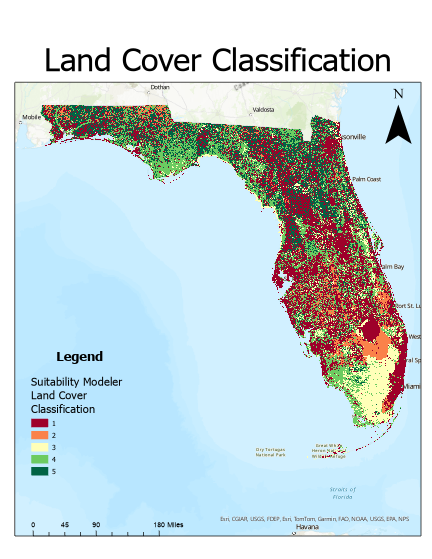
Figure 1. Reclassified land cover suitability surface Higher values indicate preferred habitat types such as forest and wetlands.
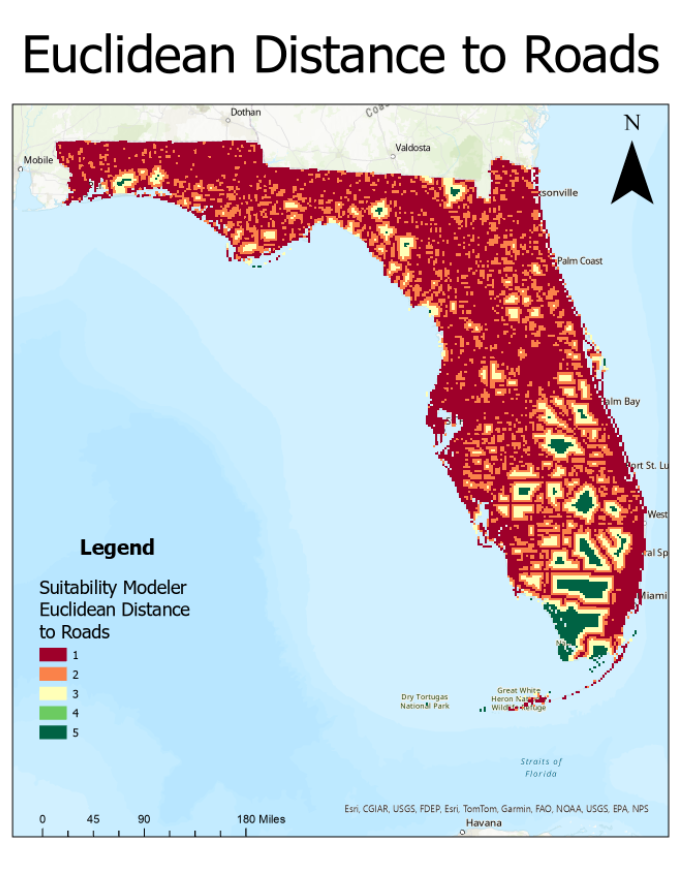
Figure 2. Reclassified Distance to Roadways Suitability Surface Higher values indicate areas farther from major roadways, which are more suitable for Florida panthers due to reduced human disturbance and lower risk of vehicle collisions.
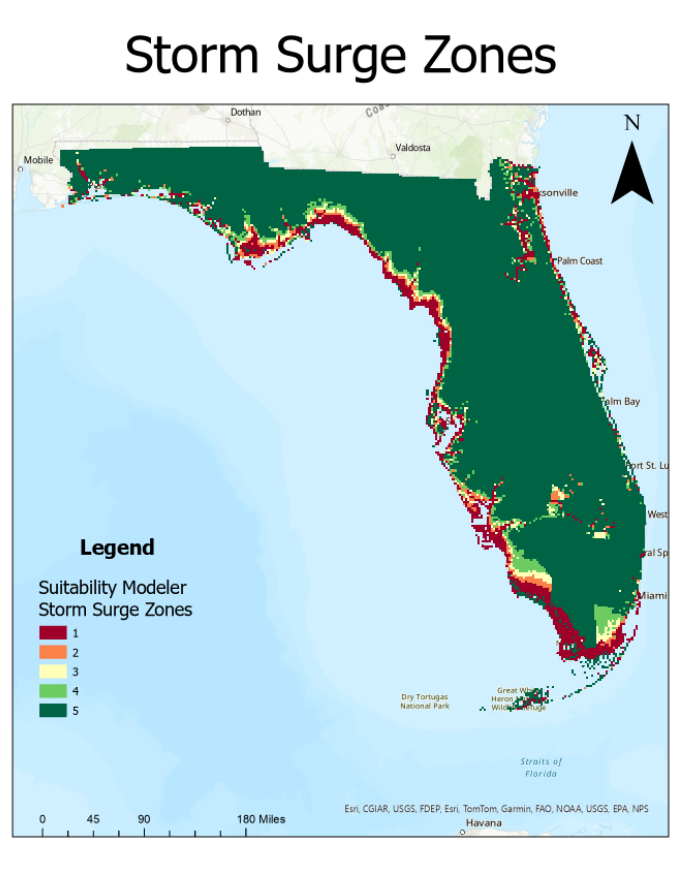
Figure 3. Reclassified Storm Surge Risk Suitability Surface Higher suitability values correspond to areas less vulnerable to coastal flooding, reflecting the preference for stable habitats not subject to frequent storm inundation.
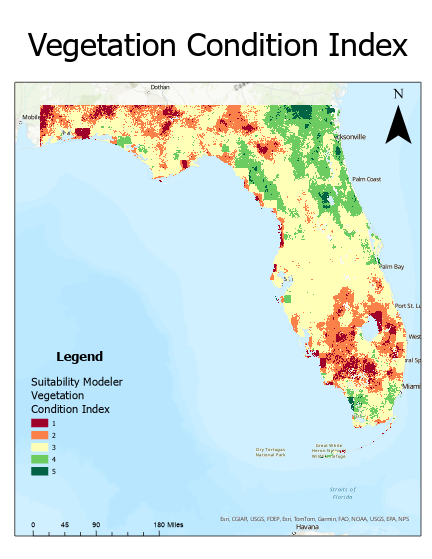
Figure 4. Reclassified VCI Suitability Surface Higher values represent areas with healthier and denser vegetation, which provide better cover and prey availability for Florida panthers.
4: Weighted Overlay
A weighted overlay approach was used to combine factors, with land cover and road proximity receiving the greatest weight due to their importance in panther habitat selection.
- Land Cover- 35%
- Distance to Roadways- 30%
- Vegetation Condition- 20%
- Storm Surge Risk- 15%
Final Suitability Model
The resulting raster identifies areas of high and low suitability, highlighting potential zones for conservation and expansion
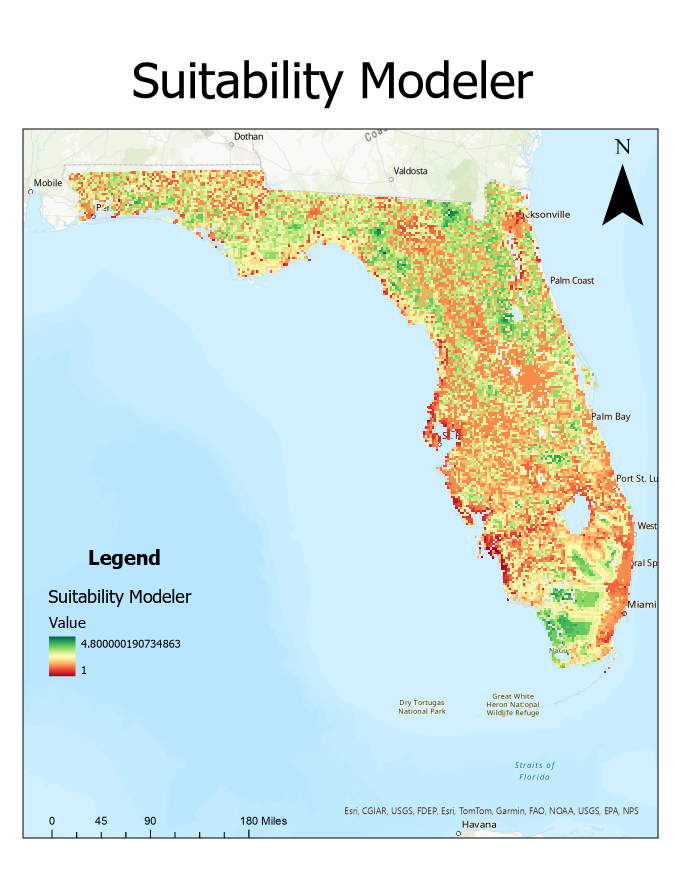
The habitat suitability model indicates that the most suitable habitat for the Florida panther is concentrated in South Florida, particularly around the Everglades and Big Cypress regions. Much of the rest of the state shows moderate to low suitability, with coastal and urbanized areas being especially unsuitable due to development and habitat fragmentation. The fragmented pattern of suitable habitat highlights the importance of protecting core habitats and maintaining wildlife corridors to support panther movement and population expansion.
Tools
- Euclidean Distance
- Clip Raster
- Reclassify Raster
- Suitability Modeler
- Raster Calculator
- Polygon to Raster Calculator
Data Sources:
- Florida Department of Transportation
- USDA Farm Services Agency
- National Land Cover Database
- NOAA Hurricane Center